


The Venue Pulse
The monthly briefing for venue & event leaders. Benchmarks, AI trends, and operational wins from 4,000+ venues.
Budget season always arrives with the same question, and it's rarely asked kindly. Someone from finance, or a VP who wasn't in the room for any of it, wants to know whether last year's conference actually paid for itself before they'll sign off on this year's number. You pull up the post-event report and see solid attendance, strong session ratings, a full expo floor. None of that answers the question being asked. Attendance numbers describe what happened at the event; they don't say anything about whether the event was worth what it cost to produce.
Event ROI is the financial and strategic return an event generates, measured against what it cost to produce. That's the number budget owners actually want, and it's the number most event teams struggle to produce on demand. This article walks through the ROI formula, what belongs on the cost and revenue side of that equation, the KPIs and non-financial value worth tracking alongside it, and how to turn all of that data into sharper decisions for the next event on your calendar.
Key Takeaways
- Event ROI measures financial return against total event cost, using the formula ((Total Revenue - Total Costs) / Total Costs) x 100.
- Total cost combines direct expenses, operational costs, and staff or travel time, while total revenue combines direct income with attributed pipeline.
- KPIs like cost per attendee, conversion rate, and check-in ratio show whether an event actually performed, not just whether it filled seats.
- Return on Objective (ROO) captures non-financial wins, like brand awareness and relationship building, that a revenue-only view misses entirely.
- Centralized event technology and a clearly defined attribution window are what make ROI numbers accurate enough to act on.
What Is Event ROI and Why It Matters
Event ROI is the percentage return an event generates relative to what it cost to produce, and the formula behind it is straightforward: Event ROI % = ((Total Revenue - Total Costs) / Total Costs) x 100. What makes that formula valuable isn't the math. It's what the resulting number lets you do. Finance teams, sponsors, and leadership don't compare investments using session feedback or foot traffic on the expo floor. They compare investments using numbers, and ROI gives your event a figure that sits next to a paid media campaign, a new sales hire, or any other line item competing for the same budget. Without it, an event's defense boils down to "attendance felt strong," which isn't a defense at all, and everyone in the room knows it.
Here's the thing: events without a defined ROI process are usually the first ones on the chopping block when budgets get tight. Not because they performed worse than other line items, but because no one on the team can point to what the event actually returned when someone asks directly. That gap gets noticed fast in a budget review, and it's a hard position to argue from. A complete picture of event ROI combines that hard financial return with non-financial value, things like brand awareness, community building, and relationship strength, which don't show up in a revenue column but still shape whether an event is worth repeating. We'll cover that side of the equation, known as Return on Objective, later in this guide. For now, the financial formula is the foundation everything else builds on, and it starts with treating event management as a discipline structured enough to generate the cost and revenue data ROI actually depends on.
How to Calculate Event ROI
The formula event teams use to calculate ROI is the same one you'll find across the industry: Event ROI % = ((Total Revenue - Total Costs) / Total Costs) x 100. Getting a number out of that formula that you can actually defend in a budget meeting comes down to three steps.
1. Add Up Total Event Costs
Start by combining every direct expense, operational cost, and staff or travel cost into a single total cost figure. We'll break down what belongs in each of those categories in the next section, but the total needs to include all three before it's usable in the formula. Leave one category out, staff time is the usual casualty, and the resulting ROI number will look better than the event actually performed. That's not a small rounding error; it's the difference between a number leadership can trust and one that quietly falls apart under a follow-up question.
That said, the goal at this stage isn't precision down to the dollar. It's making sure nothing gets missed by the time you're ready to run the calculation, since gaps here are far easier to catch before the math than after.
2. Add Up Total Event Revenue and Returns
Next, combine direct revenue, ticket sales, sponsorships, and exhibitor fees with attributed revenue: closed deals or pipeline that traces back to the event. Direct revenue is usually easy to total because it's collected on-site or during registration, and most of it clears before the event even wraps. Attributed revenue takes longer to settle, since it depends on sales cycles that run well past the event's closing session, which is why this figure often gets rushed or skipped entirely in a post-event report that goes out too soon.
3. Apply the Formula and Interpret the Result
With both totals in hand, subtract total costs from total revenue, divide that result by total costs, then multiply by 100 to get a percentage. A quick example makes this concrete: a $50,000 investment that generates $75,000 in direct revenue nets $25,000 in profit, which works out to a 50% ROI.
Put simply, a positive percentage means the event returned more than it cost to produce. A negative or low percentage isn't automatically a verdict on the event itself, but it is a signal that something in the format, the budget, or the goals needs to change before you run it again. Treat that number as a diagnostic, not a scoreboard, and it becomes a lot more useful.
Track Every Cost That Feeds Into Your Event ROI
Direct Expenses
Venue rental, permits, production, and audio-visual setup make up the largest and least flexible line items in most event budgets. These costs get locked in during contract negotiation, not estimated after the fact, so they should anchor your total cost figure from the earliest planning stages rather than getting revised as the event gets closer and the numbers start to firm up.
Operational Costs
Food and beverage, marketing and promotion, signage, and registration or ticketing software are recurring costs that are easy to underestimate in an early budget draft. They don't carry the weight of a venue contract individually, but they add up fast across a multi-day event, and teams relying on registration software built for modern events tend to catch these costs earlier, since the spend is tracked in one system instead of scattered across a dozen vendor invoices.
That said, direct expenses and operational costs only tell part of the story. The labor behind an event costs money too, even when none of it shows up on a vendor invoice.
Staff and Travel Costs
Planning hours, staff travel and lodging, and post-event admin or cleanup time are real labor costs. Leaving them out is one of the most common reasons event ROI gets overstated, because the event looks cheaper on paper than it actually was to run, and that gap tends to surface at the worst possible moment, mid-budget review, when someone finally asks about it.
Measure the Revenue Your Event Generates
Direct Revenue
Ticket sales, sponsorships, and exhibitor fees collected on-site or during registration are the easiest revenue to total, since most of it clears before the event even wraps. This is usually the number teams report first, largely because it's the number available fastest, not necessarily because it's the whole story.
Attributed Revenue
Closed deals or pipeline value tied to event leads, tracked over an agreed post-event window (commonly 90 days), often ends up worth more than on-site revenue for B2B and trade show events. The good news? This is also the revenue that proves an event's strategic value beyond the room it happened in, since it shows the event generating business long after the booths came down and the leads went cold on a spreadsheet somewhere.
Worked Example
A $50,000 event that brings in $75,000 in direct revenue nets $25,000 in profit, which works out to a 50% ROI using the formula from the previous section. That number only holds up, though, if revenue is tracked separately from softer, non-financial value, the kind covered in the Return on Objective section below. Blending the two inflates the ROI figure and undermines its credibility the moment a finance stakeholder asks how you arrived at it.
Set KPIs That Show Whether Your Event Delivered
ROI tells you whether an event made money. KPIs tell you why, and they're what you actually adjust between now and the next event.
Cost per attendee: total event expenses divided by actual check-ins, not registrations, shows the real cost of serving each person who showed up. Registration counts look better on a slide, but they don't reflect what the event cost to run for the people who actually walked through the door.
Conversion rate: the percentage of event-generated leads that turn into buyers or closed deals within the agreed attribution window. This is usually the KPI sales leadership asks about first, since it ties the event directly to the pipeline they already track elsewhere.
Check-in ratio: total registered attendees versus attendees who actually showed up. This ratio affects cost per attendee directly, and it shapes no-show planning, catering counts, and staffing for the next event on the calendar.
Sponsor and exhibitor value: booth traffic, activation participation, and lead scans help sponsors see, and renew, their own return from the event. Momentus's event management analytics tools make this kind of tracking possible without asking sponsors to take your word for it.
That said, these four KPIs work together, not in isolation. A strong conversion rate doesn't mean much if cost per attendee quietly doubled to get there, and no single KPI on this list tells the full story on its own.
Look Beyond Revenue with Return on Objective (ROO)
Not every event is built to make money directly, and ROI alone can't measure whether those events succeeded.
Return on Objective: measuring progress against the non-monetary goals set before the event, such as brand awareness, community building, or customer education. ROO gives those goals a way to be assessed with the same rigor as a revenue target, instead of getting waved off as soft outcomes nobody can quantify.
Net Promoter Score (NPS): attendee survey scores showing whether people would recommend the event. NPS is a leading indicator of repeat attendance and future word-of-mouth registrations, which matters more for an annual event than a single year's revenue number ever will.
Social and hashtag engagement: mentions, shares, and impressions generated during the event extend its reach well beyond the people actually in the room. Tracking this alongside other event engagement tactics shows whether the content strategy built around the event is doing its job or just adding noise.
Brand awareness signals: media impressions, press mentions, and spikes in website traffic during and immediately after the event round out the picture ROO is trying to capture.
ROO matters most for events where the primary goal isn't direct revenue, like internal culture events, community fundraisers, or brand-building conferences. Reviewing it apart from ROI keeps you from judging every event by a financial standard it was never built to meet in the first place.
Connect Leads and Revenue Back to the Event with Attribution
Attribution is what turns "we had good leads" into a number finance will actually accept without pushback.
Integrate with a CRM: tag every attendee and lead at the point of registration so their activity can be tracked forward instead of reconstructed after the fact. An event CRM built for this purpose keeps that tagging consistent across every event on your calendar, not just the ones someone happened to set up manually.
Track touchpoints over a set window: monitor the attendee's journey, including follow-up emails, sales calls, and demo requests, for roughly 90 days after the event to capture deals that close later. Cutting off attribution too early is one of the fastest ways to undercount an event's real return.
Review attribution honestly: determine whether the event actually influenced the final sale, or whether the lead would have converted through another channel anyway. This step takes real discipline, since it's tempting to claim every closed deal that touched the event in any way at all.
Different attribution models produce different numbers: first-touch, last-touch, and multi-touch models will each produce a different ROI figure for the exact same event. That model needs to be agreed on before the event runs, not after the numbers come in and someone starts asking which one got used.
Use Event Technology to Track ROI at Every Stage
Manual, spreadsheet-based tracking breaks down the moment an event involves multiple vendors, sponsors, and revenue sources, because the data ends up living in too many disconnected places. Someone owns the budget spreadsheet, someone else owns the registration export, and a third person owns the sponsor report, and none of those files talk to each other. Reconciling all of it weeks after the event is exactly how errors and gaps creep into an ROI number that's already hard enough to defend on its own.
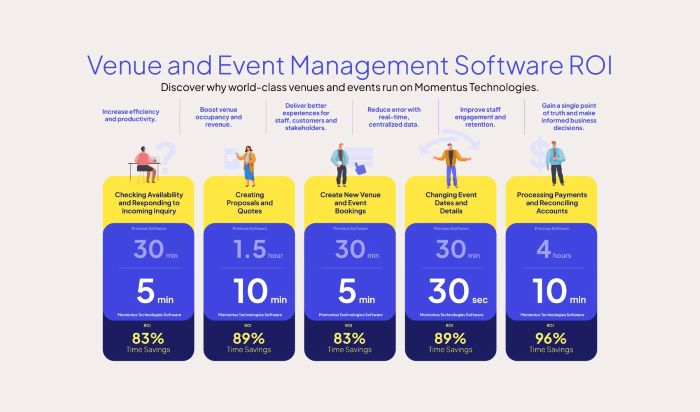
Event management software centralizes registration, budget, and attendee data in one system, so cost and revenue totals stay accurate in real time instead of getting reconstructed from memory and old email threads weeks later. AI-assisted reporting tools take that a step further, letting planners ask plain-language questions about spend, pacing, and forecasted revenue instead of manually building a report from scratch every time leadership wants an update. The approach described in this piece on navigating venue and event management in the AI era points to where that kind of reporting is headed next. ROI tracking should start before the event with budget setup, continue during the event with live registration and spend data, and extend after the event with attribution and survey data, not get bolted on after the fact once someone in finance finally asks for it.
Turn ROI Data Into Smarter Decisions for Future Events
The point of calculating event ROI isn't the number itself. It's what event management software lets you do with that number next.
Justify next year's budget with actual numbers: ROI data replaces asking leadership to trust that the event was worthwhile with a figure they can compare against every other line item competing for the same funding. A well-documented event proposal built around that number makes the renewal conversation considerably shorter.
Compare ROI across event formats: in-person, virtual, and hybrid formats each carry different cost structures, and comparing their ROI side by side identifies which format actually earns back its cost for a specific goal or audience, rather than assuming last year's format is automatically still the right one.
Flag consistently low or negative ROI as a candidate to redesign: an event that underperforms year after year is a signal to redesign, downsize, or replace it with a lower-cost alternative, like a smaller regional event or a digital campaign. Event reporting software makes that pattern visible across multiple events instead of hiding it inside one year's spreadsheet.
One low-ROI event isn't automatically a failure if it served a long-term brand or relationship goal, which is exactly why ROI and ROO should be reviewed together rather than in isolation from each other.
Measure and Improve Event ROI with Momentus
Everything in this guide comes back to the same requirement: proving event ROI takes accurate cost, revenue, and attendee data living in one place, not scattered across spreadsheets, sponsor reports, and separate registration tools. Every step we've walked through, from totaling costs to reviewing attribution honestly, gets harder every time that data has to be pulled from a different system by a different person.
Momentus is venue management software that centralizes booking, registration, CRM, and finance data on one platform, so organizers can see actual cost and revenue totals without reconciling multiple systems after the event closes. Momentus AI builds on that same centralized data, giving teams a way to query spend, pacing, and forecasted revenue in plain language instead of manually building a report every time someone asks how an event is performing.
What we consistently hear from teams is that the confidence to answer "was this event worth it" comes down to whether they trust the data behind the answer, not how good the event felt in the room. Centralized data is what makes that confidence possible, and it's worth building before your next budget review puts you on the spot. Book a Demo to see what your own numbers look like on one platform.
See what your venue is missing
Explore the platform trusted by SoFi Stadium and the Apollo Theater to fill more dates, streamline operations and maximize revenue







.svg)